In the chaotic early months of the COVID-19 pandemic, arguably the best source of information in the country on the needs of the American people, and particularly the poor, was 211 Counts, a project of WashU’s Health Communication Research Laboratory led by Matthew Kreuter, PhD, then at the Brown School and now at the School of Public Health.
211 Counts compiles data on calls made to 211 — a national helpline that connects people seeking food, shelter, transportation, health care and other necessities with local health and social service organizations — and presents the collected data on an easy-to-understand, public dashboard, updated daily and broken down by locality. For the first 15 months of the pandemic, the 211 Counts team scoured the data and produced reports two or three times a week, tracking trends in requests for help and assessing the impact of pandemic policies and practices across 38 states.
The 211 Counts team, for example, discovered that calls for food assistance skyrocketed almost everywhere in the country in the spring and summer of 2020 — except for Tennessee, most likely because of remarkably prompt and vigorous food-distribution efforts by organizations in the state. In another report, the 211 Counts team showed that COVID-19 outbreaks at meat-packing facilities in North Carolina were followed days later by a spike in calls for help with food, housing and health care in the counties with meat-packing plants. These findings were reported in The Charlotte Observer. A few months later, North Carolina Gov. Roy Cooper announced a plan to provide cash benefits to people in the hardest-hit counties to help make ends meet while they were unable to work due to COVID-19.
To Kreuter, the Kahn Family Professor of Public Health, the COVID-19 pandemic demonstrated the power of 211 Counts to provide real-time data on unmet needs. But he knew the data could do so much more, including revealing important national trends and giving early warning of impending crises. Months before the 2007 subprime mortgage crisis, the 2016 Flint water crisis and the 2022 baby formula shortage made national headlines, warning signs showed up in 211 call data, but they weren’t recognized until after the news broke. Clues to the next national crisis may be hidden in current 211 call data – if we only had the tools to see it.
“We’re sitting on a massive trove of information on what largely poor people in America need on a day-to-day basis,” Kreuter said. “There’s nothing else even remotely like it. But we’re only doing a fraction of what could be done with this data. Today, we have data on 95 million requests made since 2014, with another 30,000 being added every day. We don’t have the resources to sift through it and find all the meaningful stories they could tell us.”
A unique data cache
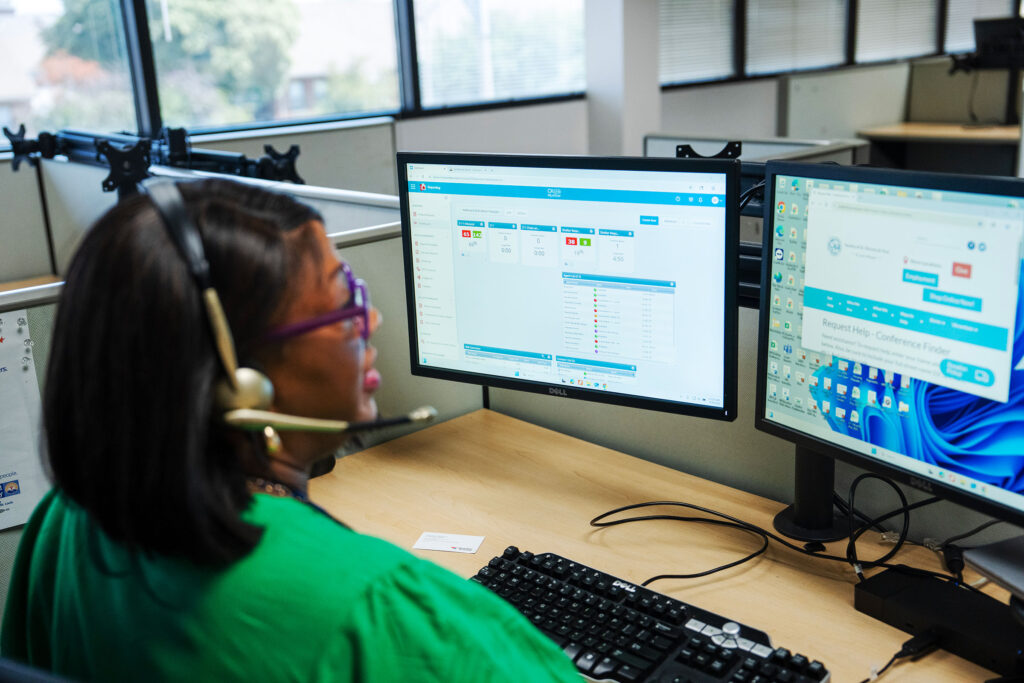
211 is a national phone number and website available to all. During disasters such as major storms, people from all walks of life call for help, but on a day-to-day basis it is primarily used by those who don’t make enough money to live. Every year, about 16 million people call, chat or text 211 because they need a bus pass to get to work, or a mattress for their child to sleep on, or to find a clinic that accepts Medicaid, or myriad other reasons. Callers are connected to a live operator who scans a database of local health and social service organizations and, whenever possible, refers people to sources of aid.
During each contact, the 211 operator records the caller’s ZIP code and reasons for calling using a standardized list of over 10,000 needs. 211 Counts groups these into 13 broad categories: housing and shelter, food, utilities, health care and COVID-19, mental health and addictions, employment and income, clothing and household, childcare and parenting, government and legal, transportation, education, disaster, and other. The records of these calls provide a unique snapshot of the needs of the American people at any point in time.
Until recently, though, call data were fragmented and difficult to analyze. While 211 is a national service, it is not a single national organization. There are more than 200 local 211 call centers, mostly run by chapters of the United Way. The call centers did not share their data with the public in a coordinated way or, sometimes, at all.
Kreuter and Balaji Golla, MS, a programmer then at the Health Communication Research Lab, established 211 Counts in 2014 to compile, organize and visualize 211 call data in a way that would be useful to researchers, journalists, policymakers, service providers and others seeking to understand the needs of their communities. The result was the 211counts.org data dashboards, now available for over 100 communities in 44 states. The free websites present 211 call data in clear and simple charts and graphs. The 13 main categories can be broken down into about 100 subcategories, and locations can be shown by geographic units such as congressional district, school district or county.
Reading the signs
During the COVID-19 pandemic, Rachel Garg, PhD, an assistant professor at the School of Public Health, started scanning the 211 Counts data every week to identify patterns in 211 calls. With the help of funding from outside organizations including United Way Worldwide, she told the stories found in the data in the form of monthly reports.
“I start with a visual analysis, looking for spikes that are unusual or unexpected, and then I do an investigation of what might be happening in that area to cause it,” Garg said. “Is there a policy change that could explain this? Is it the weather? I look at news stories and other data sets such as eviction-filing data or the consumer price index to try and figure out what’s causing these needs to rise, and then I annotate the chart.”

Funding for this program ran out last fall. One of the last reports Garg produced, in September 2024, noted a spike in requests for help paying utility bills in California, indicating that many people could not keep up with rising utility rates in the state. Another analysis showed that housing is becoming increasingly unaffordable across the country. Once primarily a concern in high-cost-of-living areas such as big cities, housing and shelter now top the list of reasons people call 211 nationwide.
Kreuter, Garg and the rest of the 211 Counts team — including Charlene Caburnay, PhD, an associate professor of practice, and Joe Steensma, EdD, a professor of practice, both at the School of Public Health — are planning to apply for funding to restart the monthly reports and, ideally, expand into the prediction business.
“One of our big goals is to create a system that alerts us in advance,” Garg said. “Rather than seeing a spike and searching the news for an explanation, we’d get a little ding that would tell us something was unusual in the data so we could look into it proactively.”
Identifying an impending crisis before it hits the headlines is no easy task. Take the subprime mortgage crisis of 2007 to 2010. A study conducted in 2015 by Karishma Furtado, PhD, then a doctoral student in Public Health Sciences at the Brown School, showed that calls for help with home repair started to drop in 2006, possibly because people suspected that they might not be able to stay in their homes and had less incentive to repair them. At the same time, requests for assistance making house payments and finding housing began to rise, a sign of increasing housing instability. The trends were subtle but clear – with hindsight. At the time, they went unnoticed.
“There’s something called aberration detection algorithms that are capable of scanning huge datasets for the kinds of small changes human observers are likely to miss,” Kreuter said. “They would flag something like, say, a need that increased by 25% in a particular area and stayed that way for a week. What does that mean? It may be nothing. It may be a blip. But at least we’re not going to miss it.”
The 211 Counts team would like to collaborate with data scientists to get more out of their unique trove of data. Until they can secure the funding to do so, however, their focus is on keeping the 211 Counts dashboard updated — a huge undertaking in itself — and on integrating data from the dozens of participating 211 call centers into an overarching national dataset to monitor national trends.
“What we would most like to do is have regular reports on what these data tell us about this moment in America and what people need,” Kreuter said. “There’s just no question that we’d be able to come up with compelling, impactful and actionable insights on a regular basis, but we need resources and collaborators to do it.”
Writer
Tamara Schneider, MPH, PhD, is the senior science writer and assistant director of communications for WashU School of Public Health. She holds a bachelor’s degree in molecular biophysics & biochemistry and in sociology from Yale University, a master’s in public health from the University of California, Berkeley, and a PhD in biomedical science from the University of California, San Diego.